Profiling and debugging
Memory profiling
Before submitting your jobs to SLURM, you should know how many resources it consumes so that you can submit to the right SLURM queue and increase memory or time limits if absolutely necessary. This section lists some of the well-known memory profiling tools, starting from user-friendly options and finishing with more complicated ones.
Memory usage can come in many flavors, the most notable of which are the virtual and resident set size (RSS) memory. In simple terms, one can think of the RSS memory that is "intrinsic" to a given process, while virtual memory includes additional overhead cost associated with loading all shared libraries and binaries that the program is linked against. For this reason, many cluster and grid schedulers, including SLURM that runs on our cluster, are configured to monitor the RSS memory of a program, and instantly kill the process if its RSS memory consumption exceeds a certain threshold. The default limit in most schedulers, including ours, is 2GB.
htop
Simply calling htop will bring the user to a table that lists the running processes and threads in the host machine.
The table dedicates one row per process (or per thread if the program is multithreaded) while each column gives more the details about the process (or thread):
PIDor process ID, that is unique ID to a given process;PRIor priority, equal to niceness + 20;NIor niceness1, a number between -20 and +20 (default 0);VIRTor virtual size memory;RESor RSS memory;SHRor shared memory;Sor status of the process;CPU%;MEM%;TIME+wall time;- Command (modulo inlined environment variables, redirections and pipes).
htop is great for identifying problems in the host machine (especially if someone's misuing it) but not so great when debugging a single program:
- The update interval can be too short to miss the actual peak memory usage;
- The user has to search for the program that they are interested in, and might never be able to find it if the process is short-lived.
time
A more accurate alternative to htop for finding peak memory usage is:
/usr/bin/time --verbose [your command with arguments]
After the program finishes, time will list key bencmarks of the process, including the peak RSS memory usage.
It is great at recognizing that there's a memory hog somewhere in your program,
but it doesn't tell you if the memory usage gradually increases over time or if there's a sudden peak.
prmon
In order to understand the memory profile a little bit better, one can use prmon:
/home/software/bin/prmon -i 1 -- [your command with arguments]
-i 1) and saves them to prmon.txt and prmon.json files
(which are reconfigured with -f and -j options, respectively) after the program terminates.
Unlike the time command, it's also possible to attach prmon to an already running program (that you yourself started) via -p option.
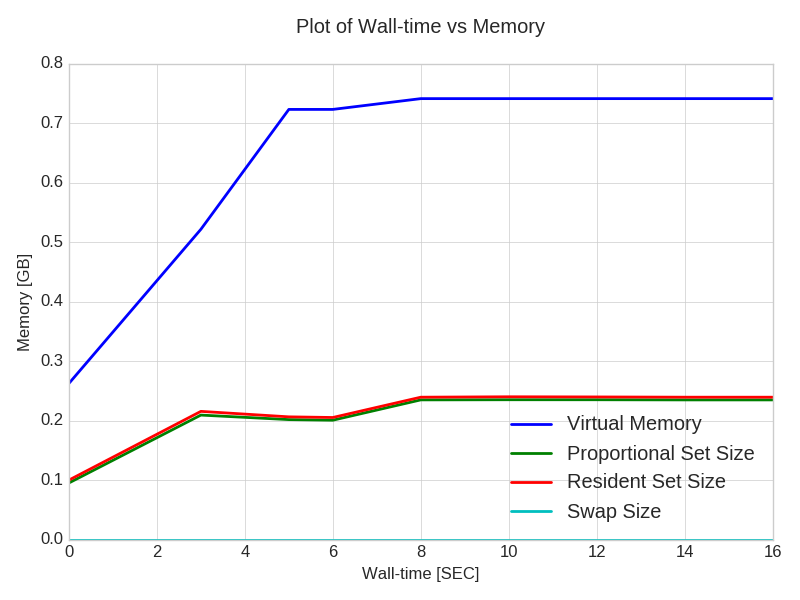
The log file can be turned into a plot detailing the virtual (VSIZE), PSS, RSS memory and swap consumption in units of GB over running time of the program with the following command:
/home/software/bin/prmon_plot.py \
  --input prmon.txt --xvar wtime --yvar vmem,pss,rss,swap --yunit GB
Valgrind
Valgrind bundle refers to a collection of profiling programs, each of which have specific purpose and range of applications.
For CMSSW users
If you're trying to debug an FWLite application with any of the Valgrind tools,
you need to make sure that the debug symbols in all of your binaries and libraries are enabled.
You can do that by rebuilding your project with gdb-friendly compilation flags:
scram b clean
USER_CXXFLAGS="-g -O0" scram b -j8
gdb.
Remember to rebuild your project with the default compilation flags (i.e., without USER_CXXFLAGS) when running your programs in normal operation.
When debugging a program that runs via cmsRun, you might have to use cmsRunGlibC instead.
massif
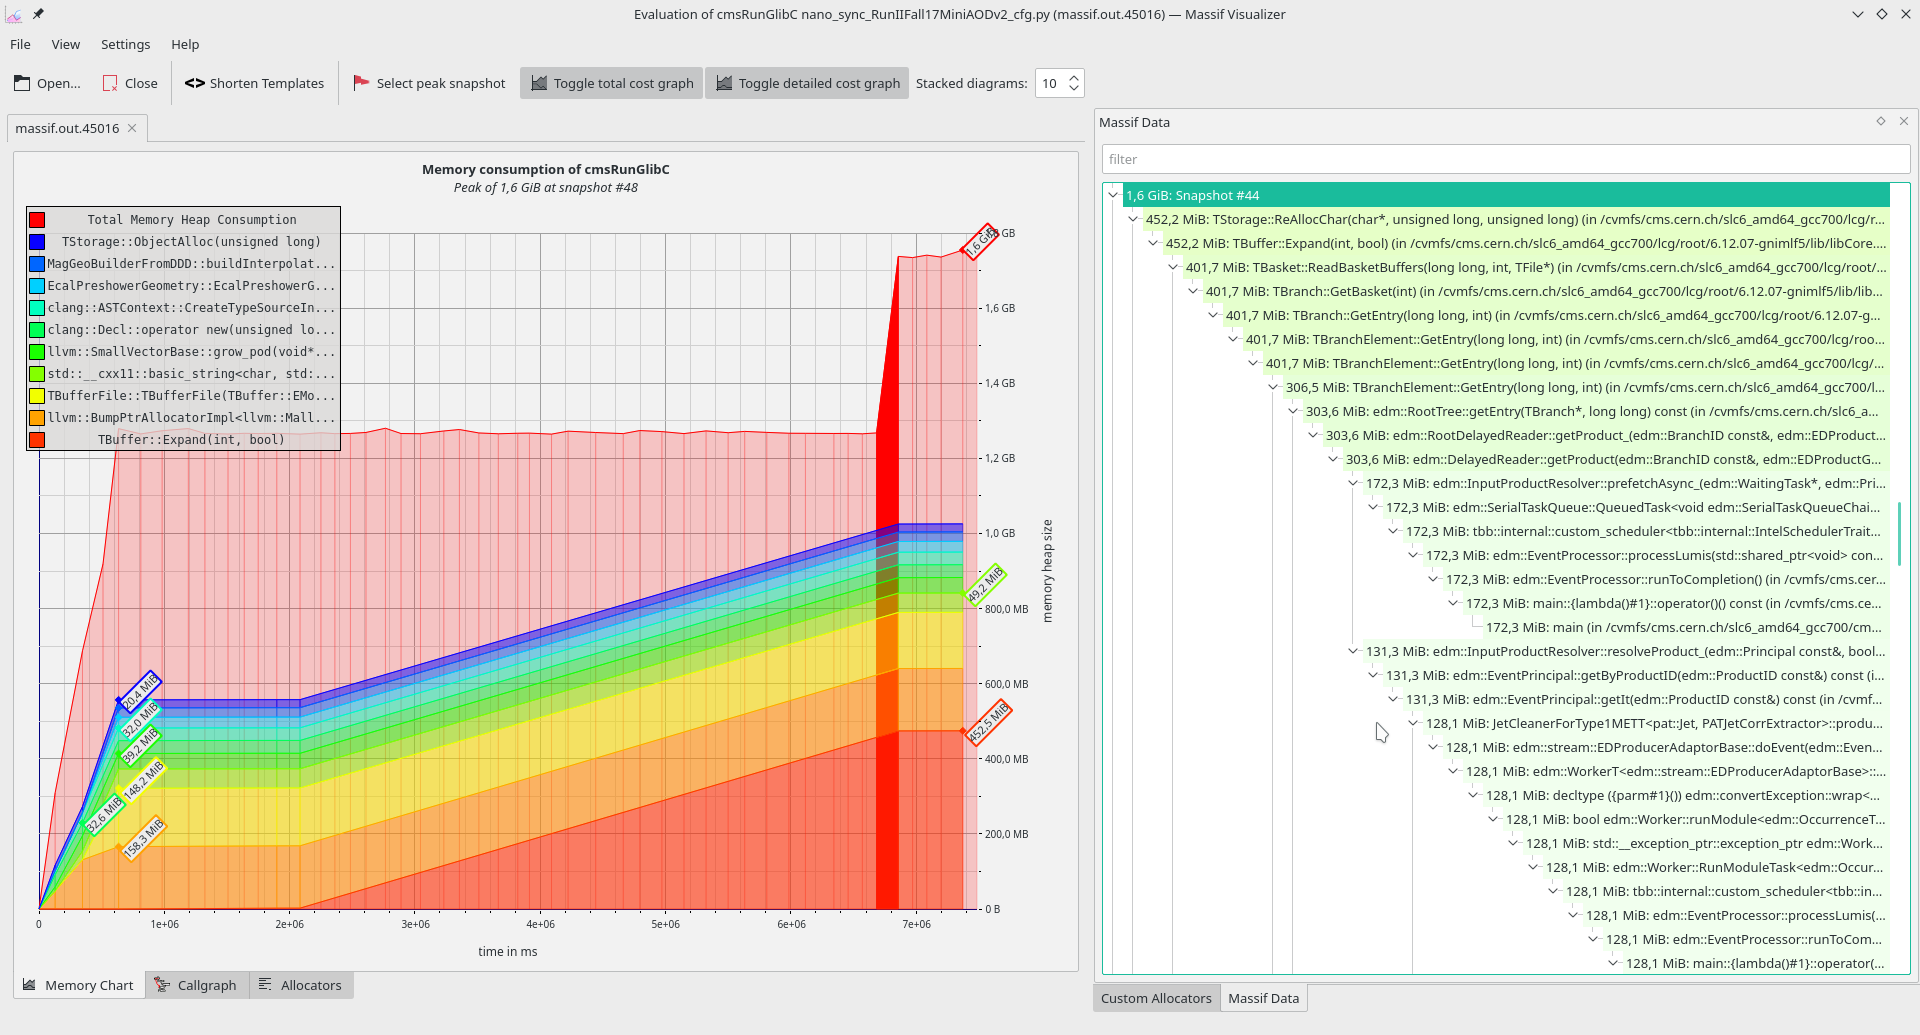
This program is very similar to prmon, as it needs an additional tool (massif-visualizer) to visualize how the memory consumption progresses over time.
The main difference is that massif monitors only the heap memory and keeps track of the calls that allocate to the heap
(so anything that's called via the new operator in C++).
Because of this additional granuality, programs sandboxed in massif take longer to finish compared to prmon (which presumably just calculates the sum of memory maps).
Example usage:
valgrind --tool=massif \
  --depth=40           \
  --time-stamp=yes     \
  --time-unit=ms       \
  --threshold=0.1      \
  [your command with arguments]
memcheck
Finally, memcheck is a heavy-weight tool that produces a very detailed report on the memory usage of your process.
In simple terms, it works by "sandboxing" or redirecting the system calls through its library,
in order to keep track of every minute allocation and free operation.
If there are more allocations than there are free operations, then we could interpret it as memory leak.
The fact that every memory operation is redirected through memcheck is also the reason why it can take very long time to run.
In certain applications (such as in real-time applications), it might even be unusable because of the lag it produces.
Note
Even if memcheck reports allocated memory that was not explicitly freed at the time when the program terminated,
it does not necessarily mean that it's a memory leak. It might've been the intention of 3rd party library developers
to allocate the memory once and leave it at that until the program exits.
Most of the shared libraries your program are linked against are necessarily not free from memory leaks (intentional or otherwise).
You can instruct memcheck to suppress those with the so-called supplicant file.
For CMSSW users
CMSSW provides its own supplicant file via the cmsvgsupp command.
Unlike any of the previous tools mentioned thus far, memcheck does not have, nor does it need an additional tool to visualize the results.
Instead, the user is expected to analyze the generated report themselves.
Valgrind's documentation gives a good overview of how to interpret the output of memcheck.
Example:
valgrind --tool=memcheck    \
  --leak-check=yes          \
  --show-reachable=yes      \
  --num-callers=20          \
  --track-fds=yes           \
  --track-origins=yes       \
  --log-file="valgrind.log" \
  [your command with arguments]
igprof
igprof can be viewed as an alternative to memcheck or massif.
It a standard tool for profiling submodules in CMSSW.
See this TWiki for more.
Debugging
Although you should always test the code before submitting it, sometimes mistakes can happen. For example, some bugs may surface only if certain conditions in the program are reached or if the assumptions about the input data are invalid for some portion of it. That's why it is important to know how to deal with such problems if they occur.
strace
strace is a tool for tracing system calls (syscalls), i.e., calls to the kernel.
It's very useful for deconstructing an otherwise complicated program that is creating lots of child processes.
strace can be attached to a running process via PID, or by running the program from through it.
Example of the latter:
strace -s 9999 -f -e trace=execve <some command with arguments> &> out.log
In this example, strace follows execve syscalls,
which instruct the current process to replace itself with a new process with intrinsic memory.
This call is characteristic to the forking operation, which is why there's -f flag that instructs strace to follow forks.
Finally, -s 9999 configures strace to show up to 9999 characters of syscall arguments (the default is just 32 characters).
Given that there are many more syscalls that handle communication with the file system, network, memory allocation, permissions, process control,
all of which require communication with the kernel, strace can be very helpful in understanding how the program works,
especially if the source code is very complicated, obfuscated or unavailable.
gdb
gdb or GNU Debugger is an interactive tool for debugging runtime errors such as segmentation violations, out-of-bounds array access.
The debugger keeps track of every function call and stops when an error condition is encountered.
You can also specify certain conditions (functions, lines of code) called breakpoints that also prompt the debugger to stop further execution of the program.
Once the execution flow has stopped (either because a breakpoint or a genuine error had been reached), you can inspect the state of the program, such as stacktrace/backtrace (i.e., the chain of function calls), threads, and local variables.
However, the output can be sensible only if the binary code you're debugging, including the shared libraries that your binary has been linked against,
has been equipped with debugging symbols, which are essentially mangled function signatures.
The debug symbols can be enabled with compilation flag -ggdb3, but it's sometimes useful to accompany it with a flag that optimizes for debugging experience (-O0 or -Og).
For CMSSW users
If you're debugging a cmsRun or FWLite application, please follow the instructions given in the valgrind section.
Example run:
$ gdb YourProgram # notice that there are no arguments
> r arg1 arg2 ... # run the program with arguments (if any)
> bt              # print stacktrace after your program crashes
> q               # quit the gdb session once you're done
The above is usually a good starting point for finding offending lines in your code.
perf
perf is advanced performance analyzer that helps, among many other things,
to determine performance bottlenecks and hotspots (points where most of the runtime is spent) in your program, count cache misses, pull statistics about threads, open files etc.
There are many resources available like this that explain how to use perf.
There are many 3rd party programs that help with visualizing the results.
callgrind
callgrind is yet another program that's part of the Valgrind suite.
The program, together with KCachegrind help to understand the function call structure of your program.
It has been used to debug situations where the program gets stuck in an infinite loop by making repeated calls to the same function.
Example:
valgrind --tool=callgrind [your command with arguments]
Intel's VTune
Intel VTune seems to the same what perf already does but with a GUI.
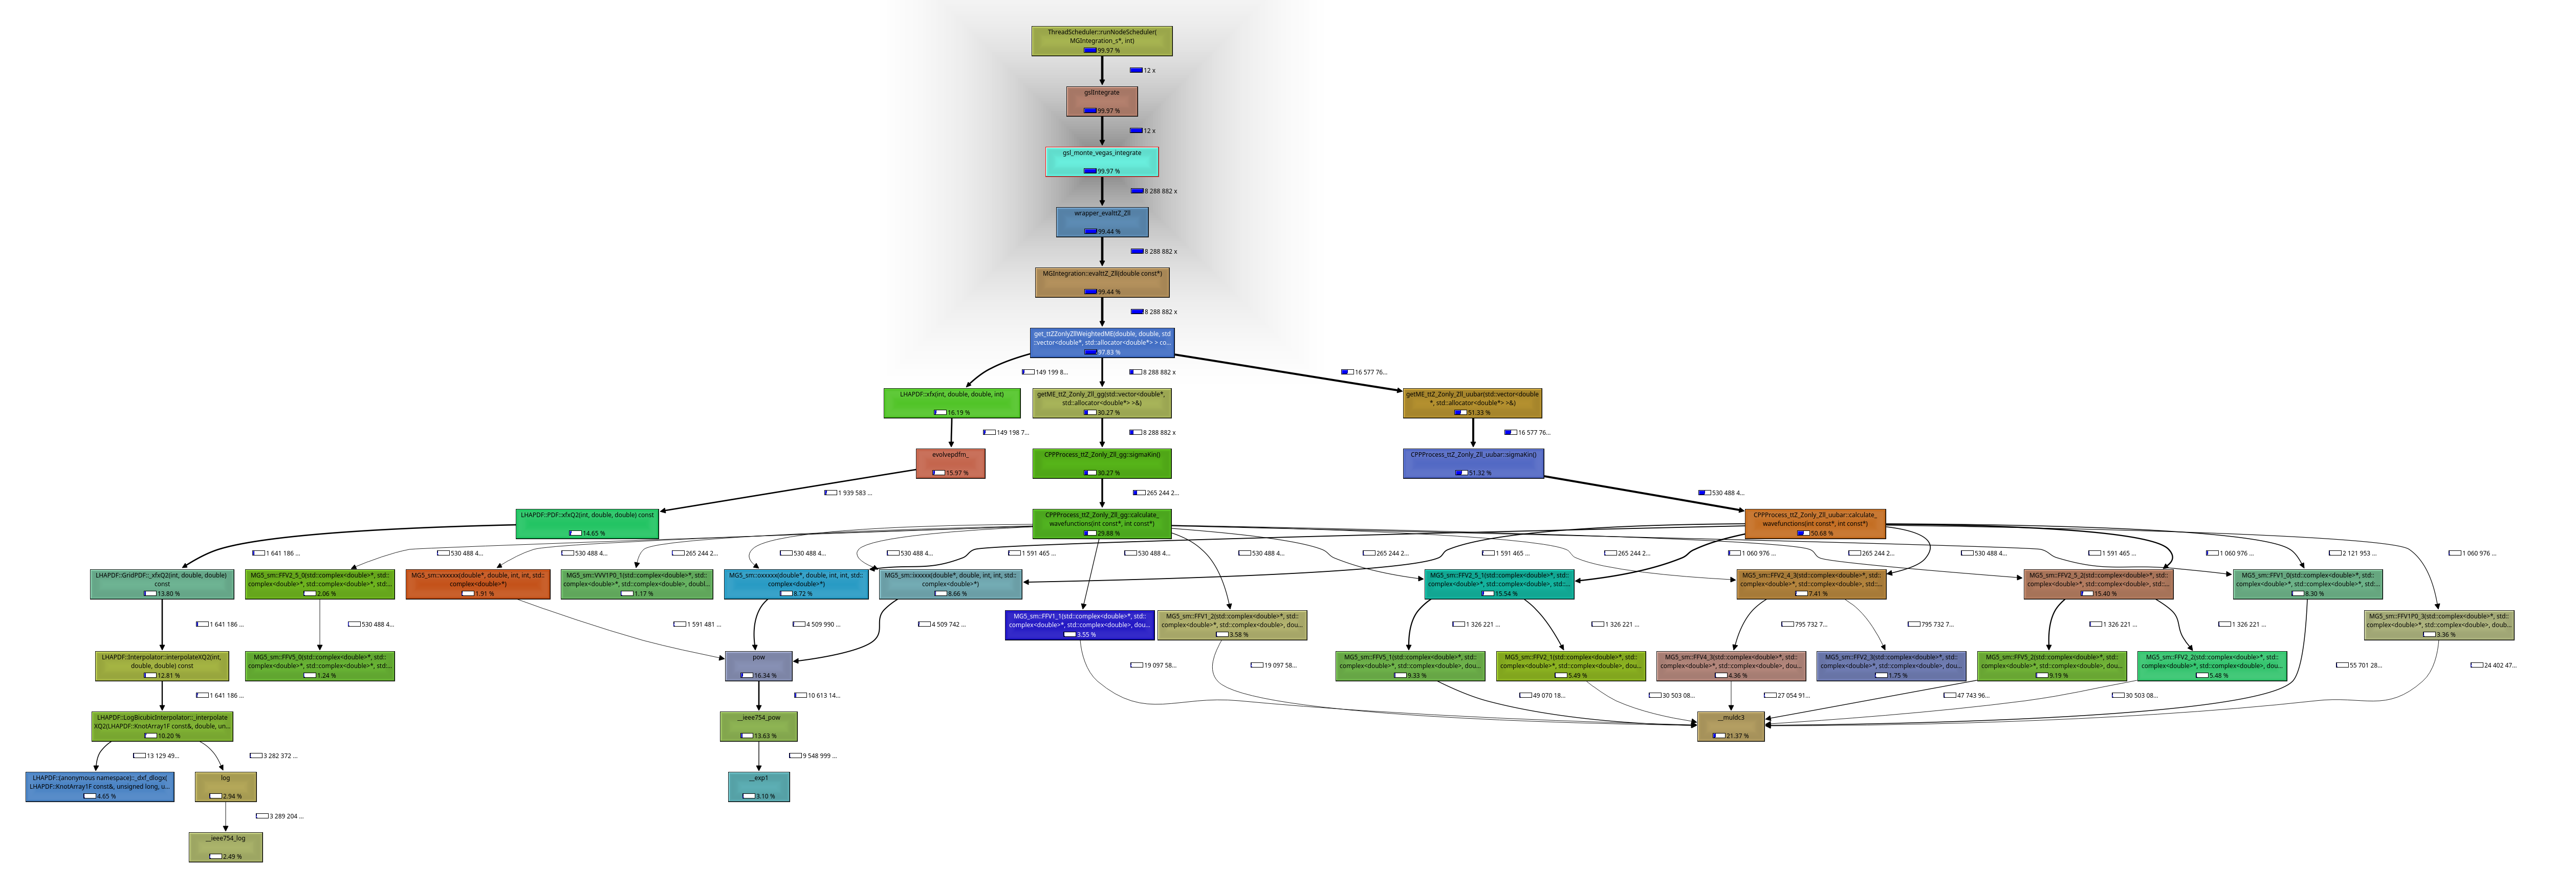
Here's an example output after running hotspot analysis on Madgraph NLO event generation, isolating to smatrix_real Fortran subroutine and filtering out the thread that took the longest to run:
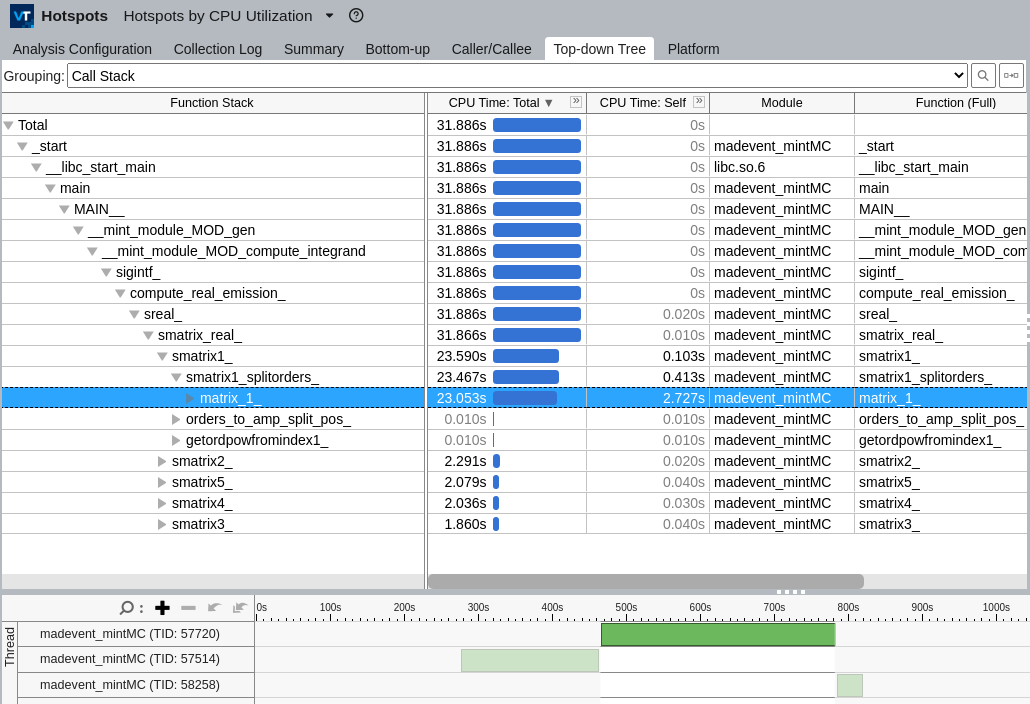
The program has a complementary command line interface that can be used to create callgraphs and detect hotspots from it:
# Run the hotspots analysis, store the results in a separate directory
vtune --collect=hotspots --result-dir=results <your command with arguments>

# Convert the output of the previous command into text file in gprof format
vtune --report=gprof-cc --result-dir=results --format=text \
  --report-output=results.txt

# Visualize the results
gprof2dot -f axe results.txt | dot -T pdf -o callgraph.pdf
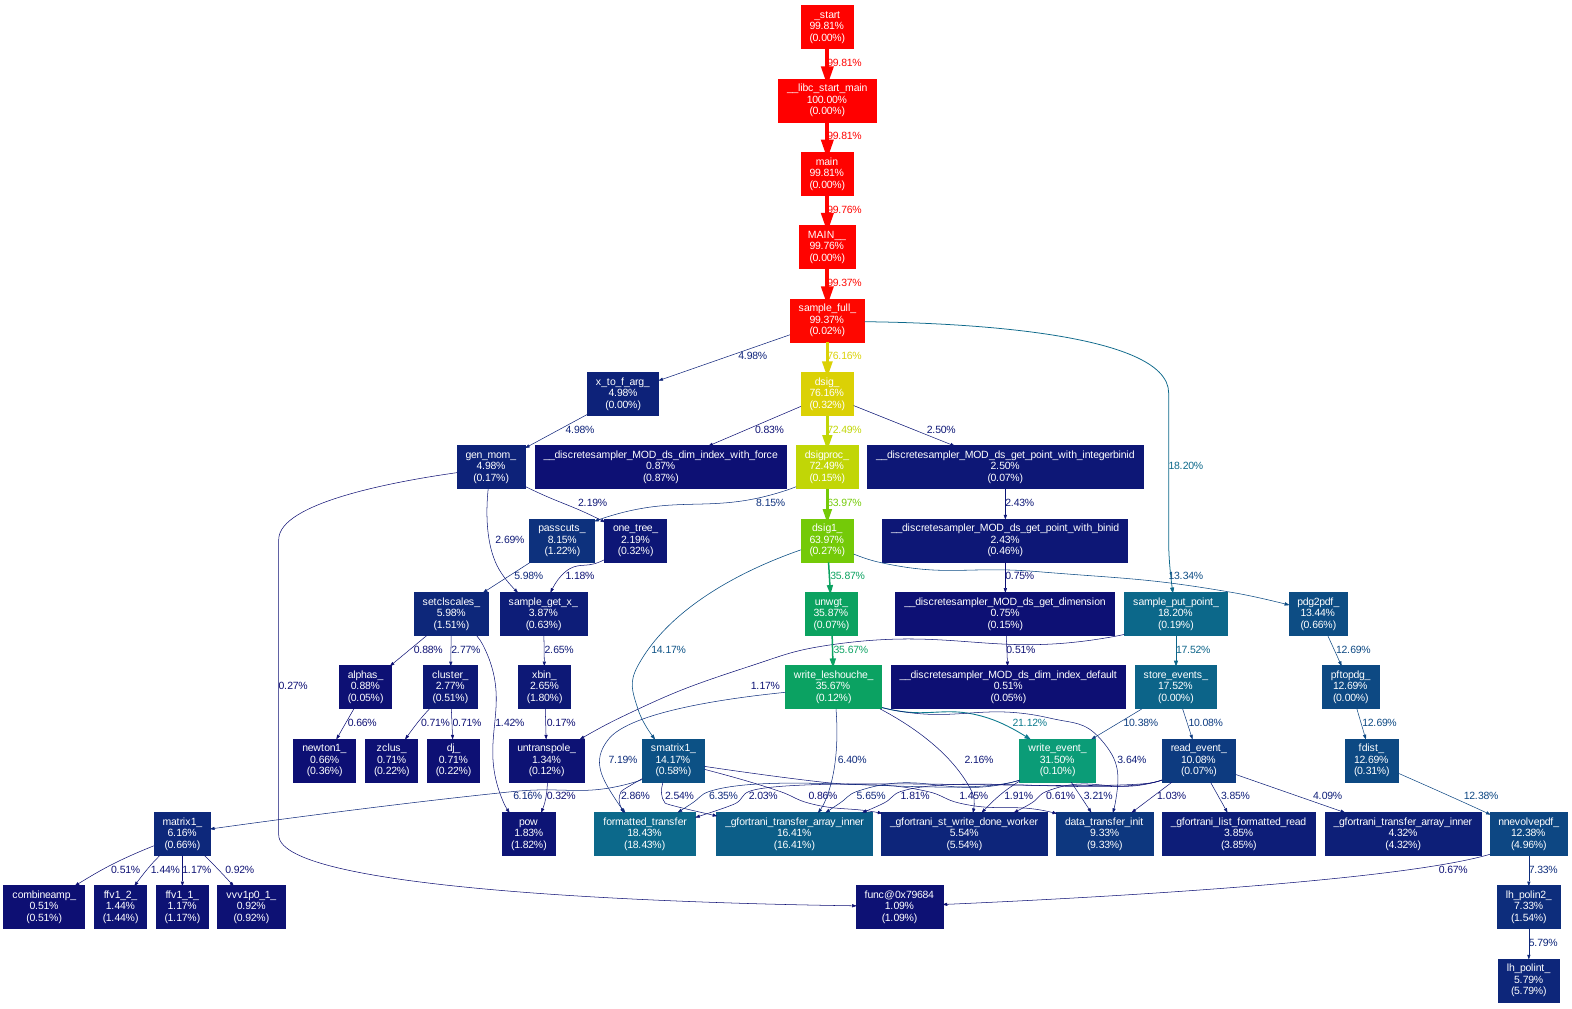
Here's an example of a callgraph produced with the above code:
